
As business fleets transition away from fossil fuels, the procurement conversation has evolved. It is no longer just about comparing an electric vehicle (EV) to a petrol or diesel alternative; it is about evaluating EV against EV.
To the untrained eye, two electric vehicles with similar battery capacities might look identical on a spreadsheet. However, differences in aerodynamic efficiency, battery chemistry, charging speeds, and body styles can create thousands of pounds of variance in operational spend.
For fleets, uncovering these hidden cost drivers requires looking past headline battery sizes and calculating Whole Life Cost (WLC)—also known as Total Cost of Ownership (TCO).
What is Whole Life Cost in an EV-to-EV Context?
In a purely electric context, Whole Life Cost measures every net expense a business incurs over a vehicle’s operational lifecycle (typically 3 to 4 years and 40,000–80,000 miles).
While both vehicles would likely produce zero tailpipe emissions, their cost profiles diverge across key operational areas:
Whole Life Cost = (Acquisition Price – Resale Value) + Energy
Evaluating EVs head-to-head shifts focus from battery size (kWh) to real-world energy efficiency (miles per kWh) and operational uptime. See below:
| Lease/Price | Energy (mi/kwh) | SMR & Tyre Wear | Downtime & Charging400v VS 800v speed |
| Battery Tech | Efficiency | Weight & Torque |
How Fleet Managers Evaluate EV Variations
Fleets use telematics and lifecycle modeling to evaluate how distinct vehicle variations impact a company’s bottom line.
1. Energy Efficiency (Miles per kWh) Over Battery Size
A common pitfall is choosing a vehicle purely because it carries a massive 90 kWh battery. If that vehicle only achieves 2.5 miles per kWh, it consumes significantly more electricity than a streamlined saloon achieving 4.2 miles per kWh over the same distance. Across a 60,000-mile contract, that efficiency gap translates into substantial energy cost differences.
Can we give an example of two vehicles, one with good efficiency and one poor?
2. Battery Chemistry & Resale Value
The underlying cell chemistry dictates long-term degradation and replacement risk.
- Lithium Iron Phosphate (LFP): Cheaper to manufacture, can be charged to 100% daily with minimal degradation, and offers higher cycle life—making it ideal for high-mileage urban delivery fleets.
- Nickel Manganese Cobalt (NMC): Offers higher energy density (longer range per kg), but incurs higher replacement costs and requires strict charging management to preserve residual values.
3. Charging Speeds & Driver Downtime
For commercial fleets, time plugged in is time off the road. Fleet managers assess whether a vehicle features a 400V or 800V architecture. An 800V system capable of 10–80% charging in 18 minutes minimises driver downtime on long-distance routes compared to a 400V model taking 35+ minutes, directly protecting fleet productivity.
EV Fleet Breakdown: Cars & Vans Compared
| Vehicle Type | Typical Efficiency | Charging Profile | Primary SMR Driver | Fleet WLC Rating |
| Efficient Compact EV / Saloon | High 4.0 – 4.8mi/kWh | Fast AC/DC charging | Low brake/tyre wear | Exceptional (Lowest cost per mile) |
| Heavy Executive EV SUV | Low 2.2 – 3.0mi/kWh | High peak DC required | High tyre degradation | Challenging (Higher capital & energy spend) |
| Small eLCV (Compact Van) | Moderate 3.2 – 4.0mi/kWh | Overnight Depot / AC | Moderate payload wear | High (Ideal for last-mile delivery) |
| Large Panel eLCV (3.5t Van) | Lower 1.8 – 2.5mi/kWh | High-power DC Depot | High tyre & suspension wear | Route-Sensitive (Requires off-peak tariffs) |
Key Vehicle Variations
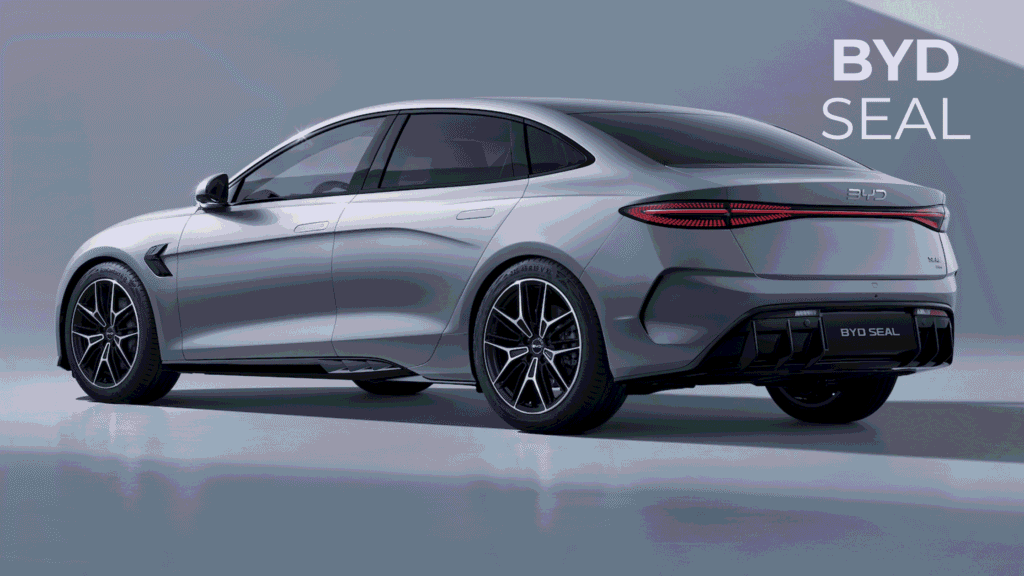
- Aerodynamics & Weight: Saloons vs. Heavy SUVs – In passenger car fleets, body shape drastically alters efficiency. A sleek electric hatchback or saloon cuts through air far more effectively at highway speeds than a boxy, heavy electric SUV. Because weight increases rolling resistance and aerodynamic drag degrades range on motorways, heavy SUVs cost noticeably more to power per mile, while also causing faster tyre wear due to their increased curb mass.

Commercial Vans (eLCVs): Payload vs. Range
For light commercial vehicle (LCV) fleets, the trade-off is payload capacity versus energy consumption.
- Small eLCVs: Lightweight vans equipped with smaller 45–50 kWh batteries excel in urban environments, delivering up to 3.8 miles per kWh through frequent regenerative braking.
- Large Panel eLCVs: Large 3.5-tonne electric vans carrying heavy cargo down motorways often drop below 2.0 miles per kWh. For these vehicles, fleet managers mitigate high energy costs by installing dynamic load-balanced depot chargers to capture lower overnight commercial electricity rates.
The Strategic Takeaway for EV Fleet Procurement
Choosing the right electric vehicle is no longer as simple as picking the model with the largest battery or longest advertised WLTP range.
By partnering with fleet management experts who analyse real-world Whole Life Costs, comparing actual miles per kWh, charging architectures, tyre lifespans, and operational profiles, businesses can select the precise EV models that maximise uptime while driving down total operational spend.